
It is remarkable how hard it is to change deeply ingrained ideas among households—ideas that businesses abandoned long ago and now profit from. A prime example is the use of payback time as the main decision criterion for energy investments. While simple, payback time is not a true measure of return. Companies know this. Instead, they focus on financing: borrowing money at lower interest rates than the returns they can generate.
This is where individuals often miss out. Homeowners hesitate, while companies use bank financing to earn money that private households could have earned themselves. The difference between using your own capital and borrowed money is known as the leverage effect. Let’s translate this concept into a straightforward example for households.
Example: 10 Solar Panels on a Home
Imagine a household installing 10 solar panels—5 facing east, 5 west—under average conditions.
Assumptions:
-
Number of panels: 10
-
Average annual yield per panel: 300 kWh
-
Total production: 3,000 kWh/year
-
Household consumption: 2,500 kWh/year
-
Grid feed-in: 500 kWh/year
-
Energy price: €0.23/kWh
-
Feed-in tariff: €0.12/kWh
Annual Savings Calculation:
-
Savings on own consumption:
2,500 kWh × €0.23 = €575 -
Income from feed-in:
500 kWh × €0.12 = €60 -
Total annual savings:
€575 + €60 = €635
Internal Rate of Return (IRR)
Suppose the initial investment is €5,000. With a 25-year lifetime:
-
Year 0: –€5,000 (investment)
-
Year 1–25: +€635 (annual savings)
The IRR comes out at approximately 10.5%, meaning your solar panels deliver a yearly return of 10.5% on your investment over their lifetime.
Financing the System: Loan Assumptions
-
System cost: €5,000
-
Loan: €4,000
-
Own contribution: €1,000
-
Loan term: 10 years
-
Interest: 3.7%
-
Lifetime of panels: 25 years
-
Annual savings: €635
1. Monthly Loan Payment
We calculate the monthly annuity for a €4,000 loan at 3.7% over 120 months. This can be done in excel but also by chat gtp.
Where:
-
P=4,000(principal)
-
r=0.037/12=0.003083 (monthly interest)
-
n=120n months
Result: €39.80 per month ≈ €478 per year
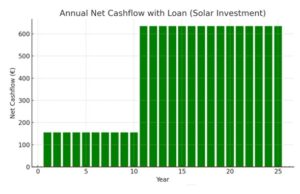
2. Net Cashflow, Years 1–10
-
Annual savings: €635
-
Annual loan payment: €478
-
Net benefit per year: €635 – €478 = €157
-
Total over 10 years: 10 × €157 = €1,570
3. Net Cashflow, Years 11–25
After the loan is fully repaid, the entire annual savings remain:
-
Per year: €635
-
Over 15 years: 15 × €635 = €9,525
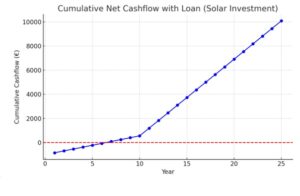
4. Total Result over 25 Years
-
Net cashflow, first 10 years: €1,570
-
Net cashflow, years 11–25: €9,525
-
Total net cashflow (25 years): €11,095
-
Initial equity invested: €1,000
5. Comparing Returns
-
Without loan: €635 × 25 – €5,000 = €10,875 → IRR ≈ 10.5%
-
With loan: €1,000 invested → €11,095 net benefit → effective IRR far higher (well above 20%)
Summary
-
Loan payment: €39.80/month
-
Net benefit, years 1–10: €157/year
-
Net benefit, years 11–25: €635/year
-
Total net benefit: €11,095 on €1,000 invested
This means the project always produces a positive net cashflow. As shown in the accompanying charts, the core logic is simple: the project earns a return of 10.5%, while the bank charges only 3.7% interest. The spread is yours to keep. This makes the return on a PV investment highly attractive.
Why Payback Time Is Not a Return Criterion
Many households still look at the payback time of an investment. It seems straightforward: you add up annual savings until the initial investment is covered.
But here’s the fundamental problem: payback time says nothing about return.
-
No account of cashflows after the payback period
If your solar panels pay back in 8 years but produce free electricity for another 17 years, payback time ignores those additional profits. The “real” return is much higher. -
No time value of money
Payback time treats €100 in year 1 as equal to €100 in year 20. Businesses and investors, by contrast, always factor in interest, inflation, and opportunity cost. -
No comparability across projects
Two projects may have the same payback time but very different returns. A project that generates larger cashflows earlier can have a much higher IRR or net present value (NPV).
How to Measure Return Properly
That’s why businesses use metrics such as:
-
IRR (Internal Rate of Return): shows the average annual return the investment delivers.
-
NPV (Net Present Value): adds up all future cashflows, discounted to today’s value.


